Form & media analytics
Which field kills conversions? Do visitors even watch your explainer video? Where do they actually click? Form analytics shows the exact drop-off point of every form, field by field. Media analytics tracks play, pause, progress milestones and completion rate of your videos. Click heatmaps layer every click cloud over a real screenshot of the page — hot red clusters mark the most-clicked spots, and a second scroll layer additionally shows how far visitors really scroll. All three modules are configured server-side and on by default once the plan unlocks them — no edit to the tracker snippet required.
# Form analytics
XICTRAQ automatically detects every <form> element on your site (no selector, no configuration). View, focus, blur and invalid events are captured per field; from these the dashboard aggregates completion rate and drop-off. Field contents are never transmitted — only field name, event type and value length.
Automatic form detection
When form analytics is enabled in the website configuration (server flag, controllable via the Analytics → Settings tab), all <form> elements are tracked automatically. No ID assignment needed, no snippet change. The form identifier is form.id, form.name or form.action (max. 120 chars). Captured event types: view (first field focus), focus, blur, invalid, submit. The field-level events focus, blur and invalid each carry field_name from input.name/id/type (max. 120 chars); view and submit are captured at form level without field_name.
Completion rate and field drop-off
The dashboard aggregates the raw events per form into a completion rate (completion_rate = sessions with a submit ÷ sessions with any form interaction, so at most 100%) and lists the number of focus, blur and invalid events for each field. At a glance you see which field many visitors touch but leave without submitting — and which field throws validation errors unusually often. The range switches between 24h, 7 days and 30 days (default: 30 days). The form analysis lives in the dashboard under Analytics → Conversions.
Privacy masking of sensitive fields
Form events never contain the entered text — only the field ID/name, the event type and, on the blur event, the bare value length (value_length, server-capped at max. 10,000). There is no field where plaintext could end up. Additionally, the tracker settings accept a list of CSS selectors whose content is fully masked during session recording too (e.g. input fields, price displays, account numbers).
# Media analytics
Native HTML5 <video> and <audio> are tracked automatically. Captured are play start, pause, ended plus the progress milestones 25/50/75 % (ended counts as 100 %). Iframe-based players (YouTube, Vimeo, Wistia) are NOT captured — they are cross-origin and offer no browser-side event hooks.
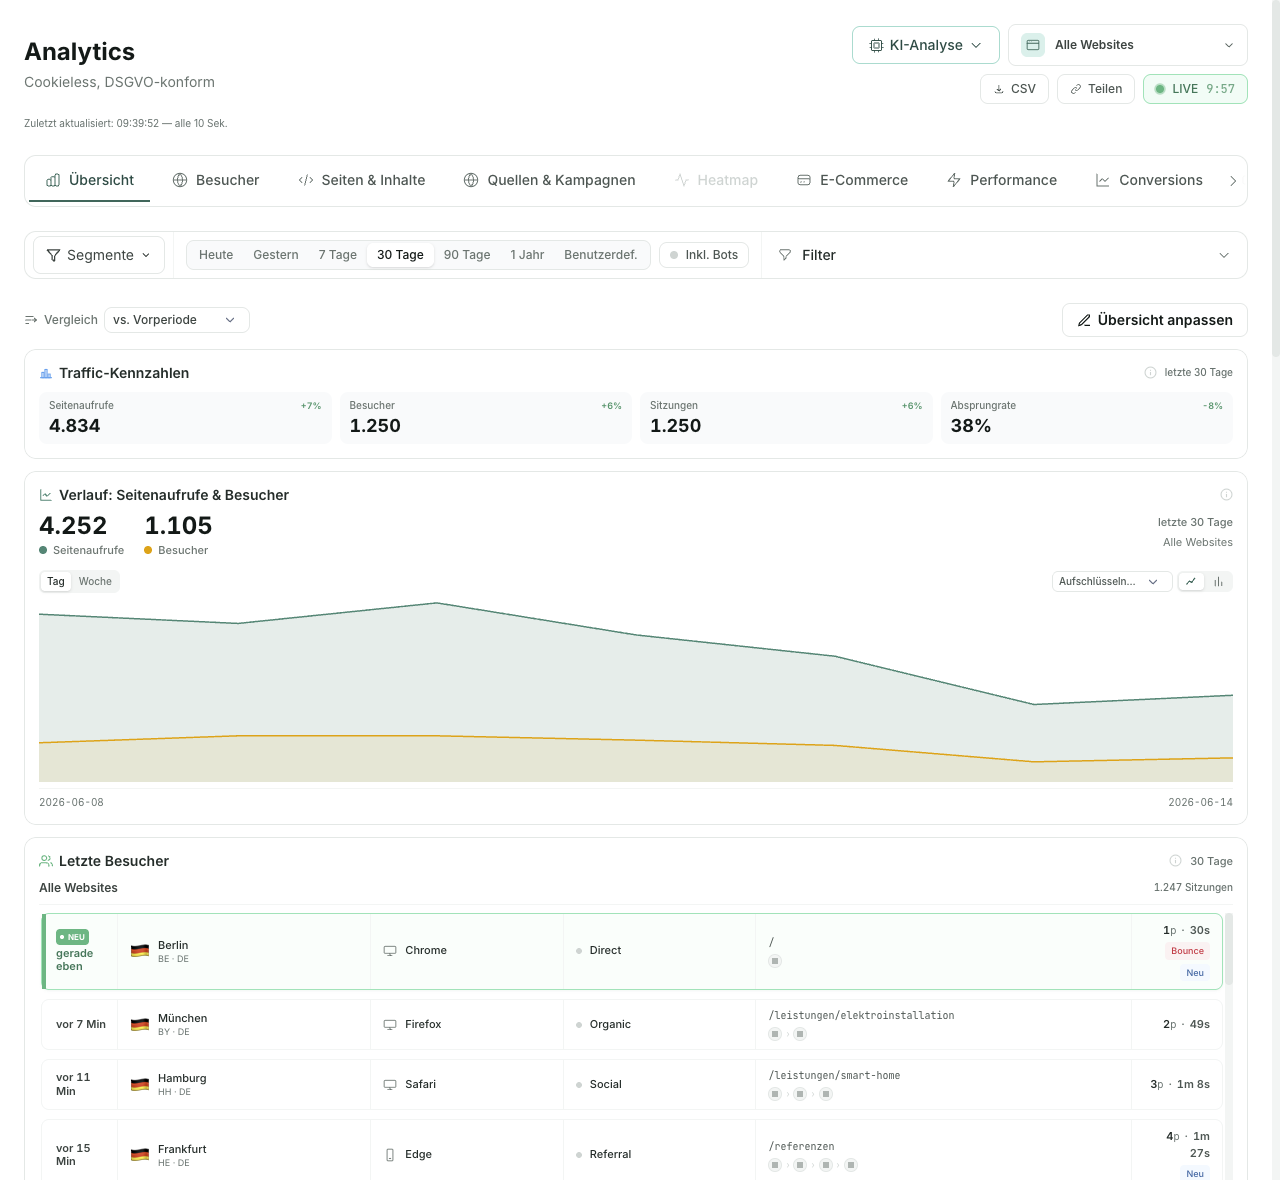
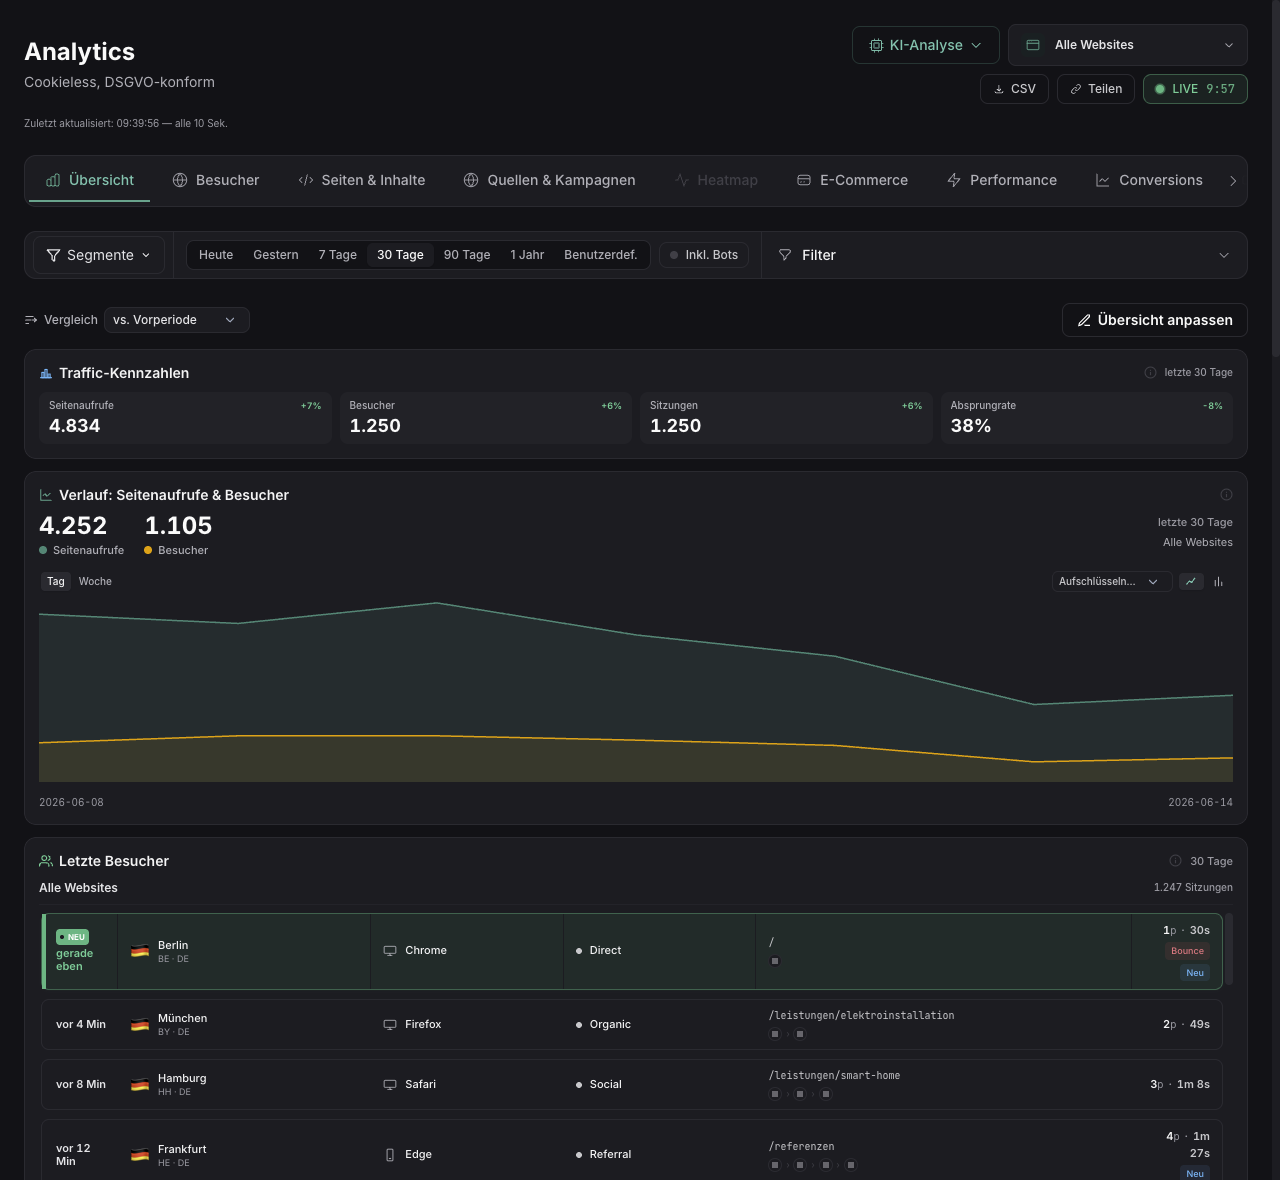
Play, pause, progress and completion rate
Every native media element fires play and pause when it is played; during playback the milestones progress_25, progress_50 and progress_75 each fire once when their mark is first crossed. When the media reaches the end, ended fires. Each event carries the media path (src, max. 500 chars, query stripped), the type (video or audio), the duration (duration_ms) and the playback position (position_ms). The dashboard aggregates this per media source into the number of plays, the 25/50/75 % marks and a completion rate (completion_rate = ended / play). You find the breakdown under Analytics → Recordings & Tests.
# Click heatmaps
Per page, XICTRAQ layers all clicks as a red-orange heat cloud over a real screenshot of the page. Overlapping clicks accumulate — the hotter (redder) a spot, the more often it was clicked. The heatmap is kept separately per viewport (desktop/tablet/mobile), and a second layer shows scroll depth.
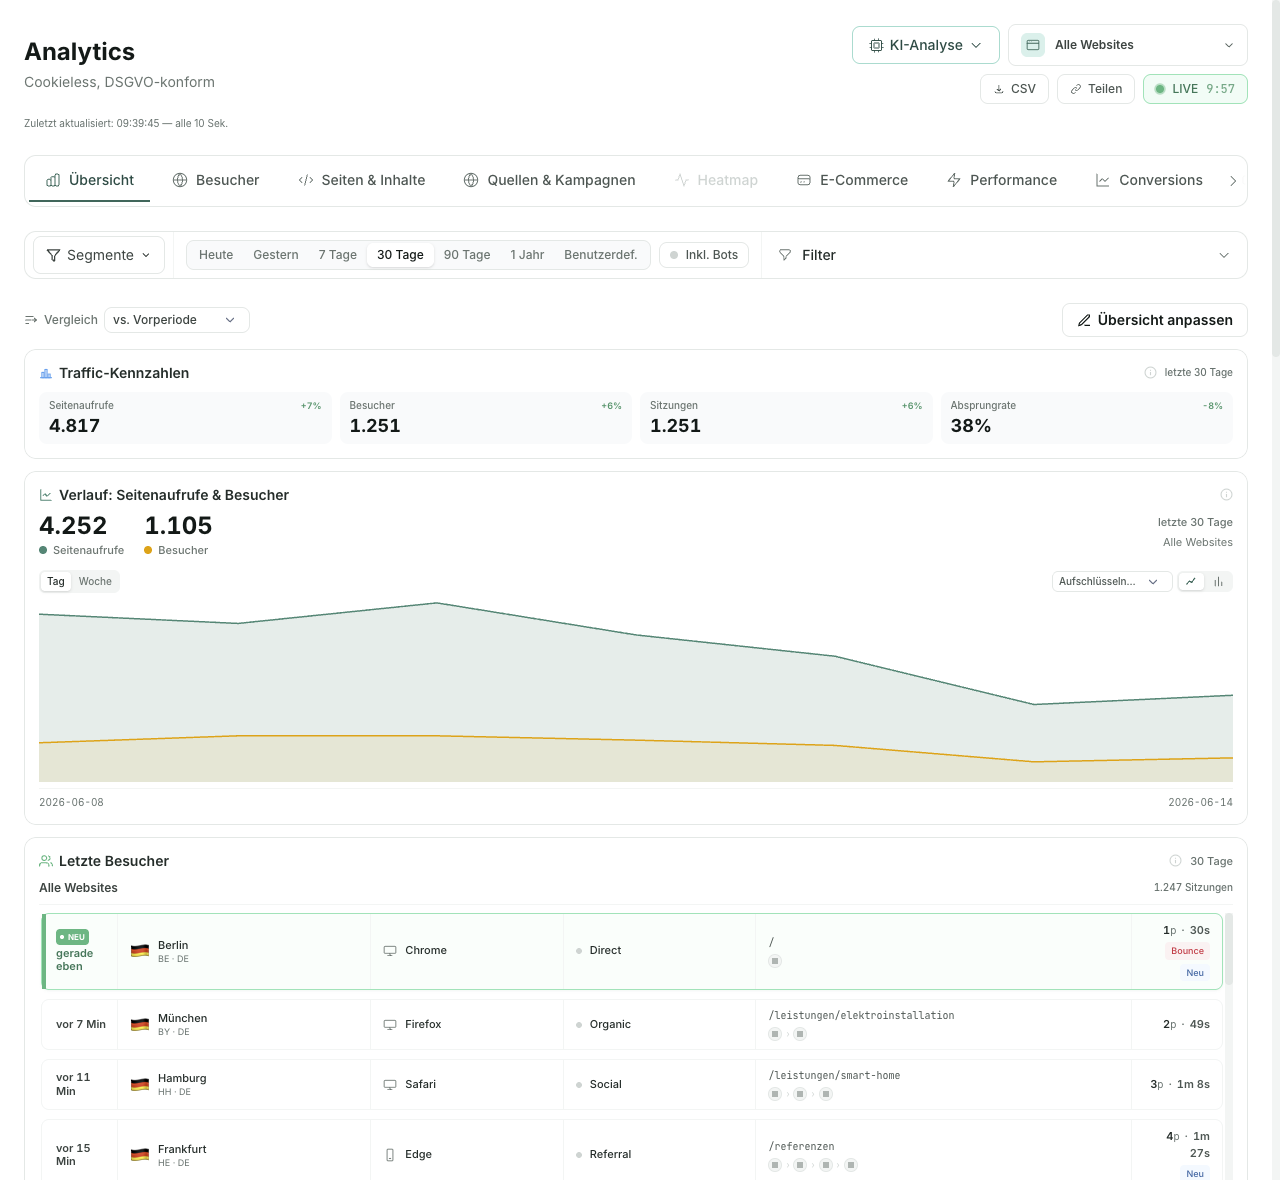
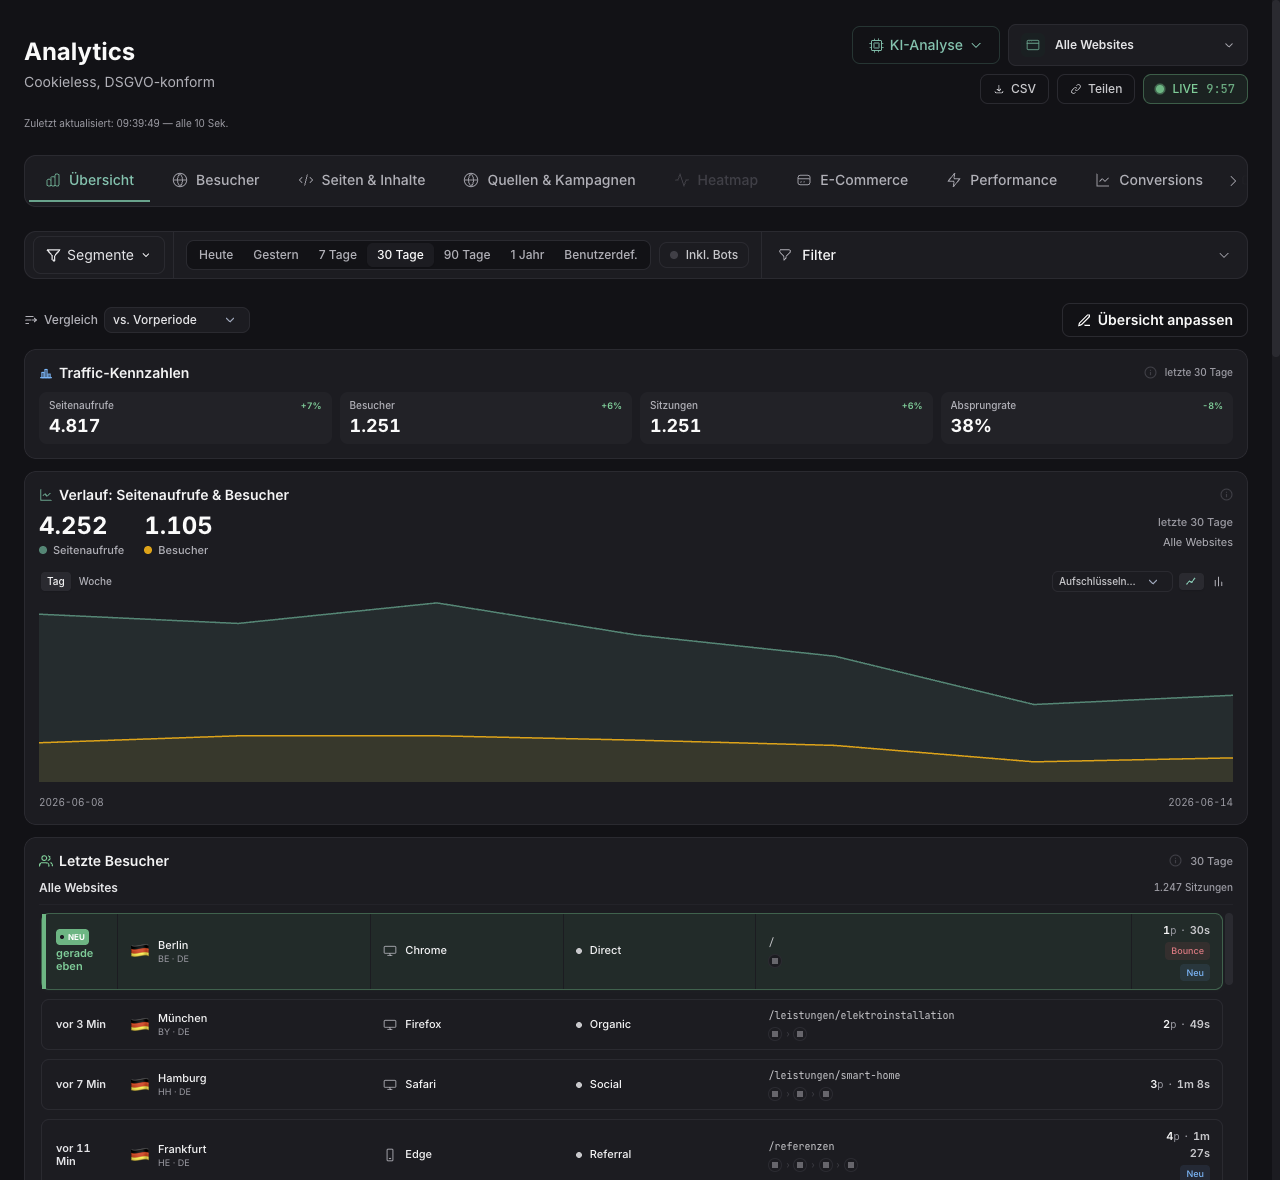
Click heatmap over a real screenshot
Click coordinates are stored not as absolute pixels but as a percentage of the full page width and height — so the heatmap remains meaningful across layout changes. Over a live Playwright screenshot of the page, a radial heat map is rendered (red = very frequent, fading through orange/yellow). Up to 10,000 clicks are drawn per view; the viewport switch also shows the click count per device class. The range spans from today through 7/30/90 days up to 365 days.
Top elements, rage and dead clicks
Next to the cloud, the dashboard lists the 20 most-clicked elements with their text label (from innerText or aria-label/title/alt, max. 100 chars). The tracker additionally classifies two frustration signals: a rage click (three clicks close together within one second) and a dead click (a click followed by no DOM change and no navigation). Both help surface broken or seemingly-clickable but inert elements.
Scroll heatmap
Via the "Scroll" layer toggle, the second heatmap layer shows how far visitors actually scroll — invaluable for long-page layouts. The page is split into four bands (0–25/25–50/50–75/75–100 %); each band is coloured by the share of visitors who still reached that depth (red = few, green = many). You instantly see at what height you lose what percentage of your visitors.
# Activation and configuration
None of the three modules is controlled via data attributes in the snippet — they are configured server-side per website. The tracker fetches its runtime configuration on every first page view from the config endpoint (keyed by the site ID) and caches it briefly. So you can toggle modules on and off without touching the embedded <script> on the customer site.
The per-website configuration (table websites.tracker_config) has the following defaults. Form, media and heatmap tracking are already active; session recording is deliberately off as a privacy-relevant opt-in:
{
  "forms":          true,    // Form-Analytics
  "media":          true,    // Media-Analytics
  "heatmap":        true,    // Click + scroll heatmap
  "web_vitals":     true,    // LCP / CLS / INP
  "record":         false,   // Session-Recording (Opt-in)
  "consent":        "none",  // "none" | "required"
  "mask_selectors": [],      // CSS selectors masked in recordings
  "exclude_urls":   [],      // Regex paths that are not tracked at all
  "sample_rate":    100      // 1..100 (percent of sessions captured)
}
Sampling and excluded paths
Via sample_rate (1–100) you capture only a percentage of sessions on very large sites — the decision is made server-side per session from a fixed bucket of the session value, so a captured session is captured completely and a dropped one is dropped completely. With exclude_urls you store regex patterns for paths that should remain entirely untracked (e.g. internal areas). Both values apply to the whole tracker, so to form, media and heatmap events as well.